ABC cross analysis
ABC analysis, when performed at the same time with more factors, is a powerful tool to make correct decisions especially in inventory management
Optimize your inventory !
ABC cross analysis can be performed through a cloud-based software capable to analyse and monitor the improvements, so maximizing profits and customer service.
Totally Cloud
ABC cross analysis performed through a cloud based software.
It has not to be installed and you only need an internet connection.
You can access to the program from any browser with your username and password.
Responsive
You can visualize all the reports with the advances admin area from any device! It is not any more necessary switch on your laptop or desktop, but you need a tablet or a smartphone on the go.
Offline Report
An internet connection is not always available, so it is possible to download all the reports.
Once downloaded, you can visualize them with spreadsheet software like Excel®, etc.
Analysis
ABC cross analysis is based on the Pareto principle (Italian statistician, 1848-1923). This software allows to get the right priority to manage items (up to 150000) in a warehouse.
The class A items are those whose sum equals 80% of the feature to be analyzed; B items for the further 15%, and C items for the remaining 5 %.
The various factors than can be taken into account are:
- Cost of goods sold (COGS)
- Shipped quantity
- Shipped volumes
- On hand inventory (value, quantity, volume)
- Profit
- Number of picking lines
Statistically point of view, the A items can be about 20 % of the totality, B items about 30 %, and C items the remaining 50%.
As a consequence, it is productive to keep our attention on the A items first (with only 20 % of the items we master 80 % of the considered feature), and to leave the C items just at the end of the analysis (also if they are about half of the totality), because they count the 5% of the feature taken into consideration.
ABC cross analysis
The software elaborates an ABC cross analysis, the ouput are reports and seven interactive matrices where two features are crossed, such as:
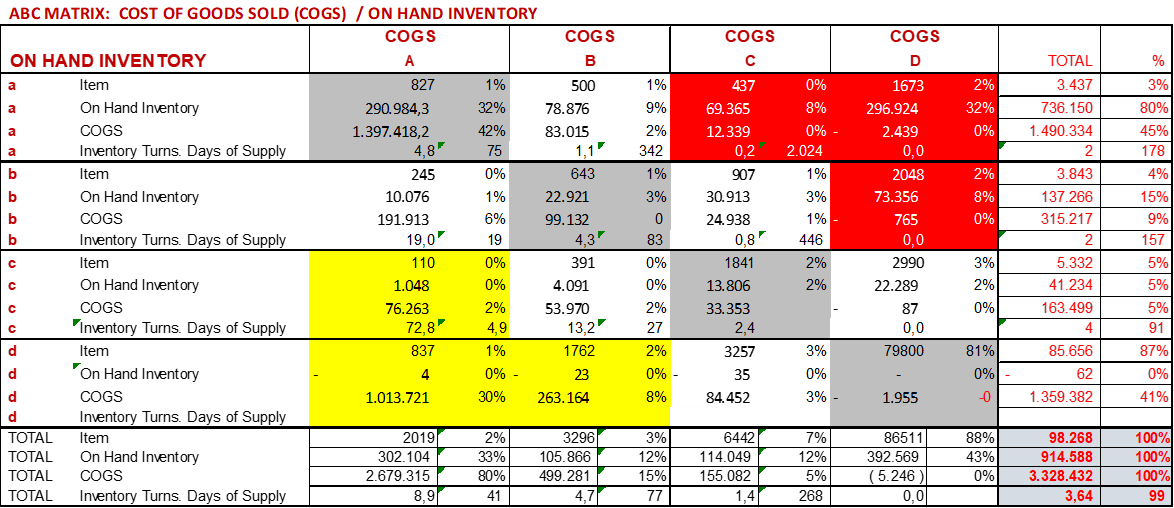
1) Cost of Goods Sold/On hand inventory (value);
2) Shipped quantities/On hand inventory (quantity);
3) Cost of Goods Sold / Profit;
4) Cost of Goods Sold / Number of picking lines;
5) Shipped quantities / Number of picking lines;
6) On hand inventory / Number of picking lines;
7) Shipped volumes / On hand inventory (volumes)
The goal of these matrices is :
Matrices 1 and 2: to select the items with an excess inventory and at high risk of stockout; furtherly you have the inventory turn and days of supply. They are useful to correct the inventory level of the above items.
Matrix 3: to select items at negative or low profit. It is useful to revise the price and the cost of the above items.
Matrices 4, 5 e 6 : to select the items to be allocated closed to the shipping area. They are useful to correctly allocate the items in a warehouse.
Matrix 7: to select items with excess space occupied compared to the shipped one (space consuming items). It is useful to allocate these items correctly in location at low value of space, and better estimate their increased transportation costs.
The ABC cross analysis, periodically executed (at least quarterly), allows to:
- Optimize the on hand inventory (values, quantities, volumes)
- Reduce the working capital
- Monitor the profitability
- Reduce picking costs (about 50 % of the storage costs)
The following indicators are also calculated:
COI (in matrix 5): Cube per Order Index (On hand inventory (quantity) / Number of picking lines)
The lower is COI, the closer to the shipping area the items are to be allocated
EAQ (in matrix 6): Economic Assignment Quotient. (Number of picking lines / square root of shipped quantities)
The higher is EAQ, the closer to the shipping area the items are to be allocated
Significant results (also inventory reduction of about 20-30 %) can be achieved in the first quarter of usage.
For any information and a demo we are at your kind disposal.
Example of an ABC cross analysis